
TCFD disclosure as of 2021
Sumitomo Mitsui DS Asset Management announced its support for the Task Force on Climate-related Financial Disclosures (TCFD) in December 2019. As an asset management firm, we will analyze the impact of climate change on investee companies, both risks and opportunities, and try to translate such an analysis into high-quality investment returns to clients over the long term. At the same time, through engagement we will contribute to realize a sustainable society by supporting the innovations and transitions of investee companies aimed at reducing greenhouse gases.
Governance
1.Supervision by the Board of Directors
Our corporate philosophy and the Principles of Fiduciary Duties and Sustainability, which serve as the basic policy for our corporate activities, clearly state our intention, as an asset management firm and as a corporate citizen, to contribute to build a sustainable society. Therefore, sustainability initiatives, including for climate change, are positioned as the most important task of management.
Basic policies and action plans at the company level are developed through an established process in which the policies and plans are fully considered by the Sustainability Promotion Subcommittee at the practical level and by the Management Meeting, which is attended by the CEO and executive officers, and then approved by the Board of Directors. In addition, the Board of Directors receives reports twice a year on the progress of action plans and monitors whether processes are being carried out appropriately.
Moreover, the Board of Directors actively discusses the form of ESG integration in the investment process, the state of stewardship activities, operations that take sustainability into account, and other related matters. In addition, outside directors with ample expertise provide advice and recommendations to management.
2.Role of Management Team
Company-level policies and actions plans related to sustainability, including climate change, are formulated through a process that involves discussions led by the officer in charge of the Corporate Strategy Department in coordination with related internal departments. Deliberations are conducted by committees, including the Management Meeting, which is attended by the CEO and executive officers, and then, depending on the importance, approval by the CEO or Board of Directors. These policies and plans are executed under the responsibility of the CEO, while stewardship activities are led by the Responsible Investment Officer, investment management, by officers in charge of the Investment Management Division, and our own risks and opportunities, by officers in charge of corporate divisions, which allows us to respond quickly to individual risks and opportunities.
Strategy
1.Climate Change Risks and Opportunities
We recognize the following as risks and opportunities caused by climate change.
| Risks |
|
|---|---|
| Opportunities |
|
2.Impact on Business and Strategy
| Investment | All of our active investment products are managed taking sustainability into account. Based on the increasing importance in recent years of non-financial information, including on climate change, we are working to further improve investment performance by conducting qualitative and quantitative research on the impact of non-financial information on stock and bond prices. Furthermore, as a responsible institutional investor, through engagement (dialogue with investee companies) and exercising voting rights we support the practical application of innovations that will help smooth the transition to a carbon-free economy and solve the problem of climate change. |
|---|---|
| Product Development | Continuing inflow into ESG-related products in Japan and overseas is observed in conjunction with rapidly rising interest in sustainability. To meet these changing client needs, we work to develop and provide investment products that integrate sustainability into the investment process in a consistent way and products with promoting sustainability as the investment objective. |
| Operations | At the same time, we have set a 2030 target of effectively zero for our own greenhouse gas emissions (Scopes 1 and 2) and are working to reduce energy consumption through such measures as promoting efficient office use, procuring renewable energy, and promoting paperless operations. Further, we established a sustainability procurement policy in July 2021 and are working to reduce greenhouse gas emissions on our supply chain (Scope 3). |
3.Impact on Finance
One study* has found that if the temperature has risen by 2℃ as of 2100, global GDP per capita in 2100 will be around 15-20% lower than the case assuming temperature remains unchanged from the first decade of this century. This can be expected to have a negative impact on our profits due to the declining market caps of global stock markets. On the other hand, at the level of individual sectors and companies, there are likely to also be cases of performance growth from innovative technology and changes in people's lifestyles. As an asset management firm with strength in active investment, we will work to minimize the negative financial impact by carefully assessing and investing in sectors and companies where growth can be expected.
Since we are an asset management firm however, we do not own production facilities that emit greenhouse gases, so we do not anticipate major transition risk. Moreover, we operate our business out of relatively small offices located in major cities in Japan and overseas, so we do not expect any major physical risks from climate change. Carbon offsets, which will be needed for us to achieve effectively zero greenhouse gas emissions by 2030, are a factor that will increase costs, but we expect to be able to minimize the impact.
*Overview of the IPPC's Special Report on Global Warming of 1.5℃ (July 2019), Ministry of the Environment
4.Analyzing Alignment with the Paris Agreement
We have implemented a compatibility analysis on the funds we manage (”SMDAM funds” hereafter) so as to confirm the consistency of our portfolio with Paris Agreement goal. Our analysis was conducted utilizing “Paris Agreement Capital Transition Assessment” (PACTA), a tool developed by the independent think tank “The 2° Investing Initiative (2DII)” with partners such as the UN PRI, etc.
Target and Method of Analysis
| Scope of Target |
The SMDAM funds consist of global equities and corporate bonds as of 30th June 2021. The following funds were excluded from the analysis.
|
|---|---|
| Method of Analysis |
Utilizing PACTA, we have analyzed the consistency of our portfolio over the next 5 years with the “2-Degree Scenario” which had been targeted in Paris Agreement. The compatibility analysis was conducted in 7 following sectors that accounts for approximately 75% of global GHG emissions. * We use the “Global Energy and Climate Outlook (GECO) 2020” as a scenario, which was reported by the EU Science Hub, part of the European Commission.
|
Results
“Oil and Gas (28%)”, “Electric Power (power generation only, 7%) “, and “Steel (6%)” are sectors that account for high percentage of GHG emissions in the SMDAM funds, while the other four sectors had a very low rate.
As a result of scenario analysis over the next 5 years, we also found that “Oil and Gas” and “Electric Power” sectors are aligned with Paris Agreement goal, or could be aligned with the target without severe impact on our portfolio by reallocating some of our assets. On the other hand, the “Automobile” sector is not aligned with the target unless the drastic progress in EV adoption by 3 major Japanese automobile companies.
We believe that innovations will gradually implement a decarbonized society, and radical de-carbonization such as to abandon the use fossil fuels could cause unexpected inflation and environmental destruction as a result.
With such conviction, our investment policy is to engage investee companies to obtain SBT (Science Based Targets) certification and to improve CDP climate change scores, while considering an option to divest high GHG emissions sectors and/or companies.
Composition of funds by Sector
| Industry |
Composition of GHG emissions by industries |
Sector Weight of SDMAM funds |
|---|---|---|
| Oil and Gas |
28.4% |
1.6% |
| Power Generation |
7.0% |
2.4% |
| Steel |
5.7% |
1.4% |
| Automobile |
1.9% |
6.3% |
| Cement |
0.2% |
Less than 0.1% |
| Coal |
0.1% |
Less than 0.1% |
| Air Transport |
Less than 0.1% |
0.2% |
Industry Analysis: Power Generation, Oil and Gas, and Automobiles Sectors
| Industry | Results |
|---|---|
| Electric Power |
SMDAM has estimated the required investment amount to fulfill the deviation from the Paris Agreement goal, and we have confirmed that it could be accomplished by increasing our investment to renewable energy related companies. |
| Oil and Gas |
SMDAM has confirmed that the Paris Agreement goal could be accomplished without severe impact on our portfolio by replacing some of the related stocks. In particular, the reallocating our current portfolio companies to the companies that have oil fields with lower associated gas production is a possible solution derived from our analysis. |
| Automobile |
Drastic acceleration of EV production by our investee companies is indispensable. |
CDP Climate Change Score of our Portfolio
CDP gives “Climate Change Scores” to global companies by assessing their GHG emission reduction targets and the effectiveness of action plans to achieve their targets. A comparison of the score distribution between our funds and MSCI ACWI shows that our funds has a high proportion of A/A- and B/B-.
Percentage of CDP Climate Change Score
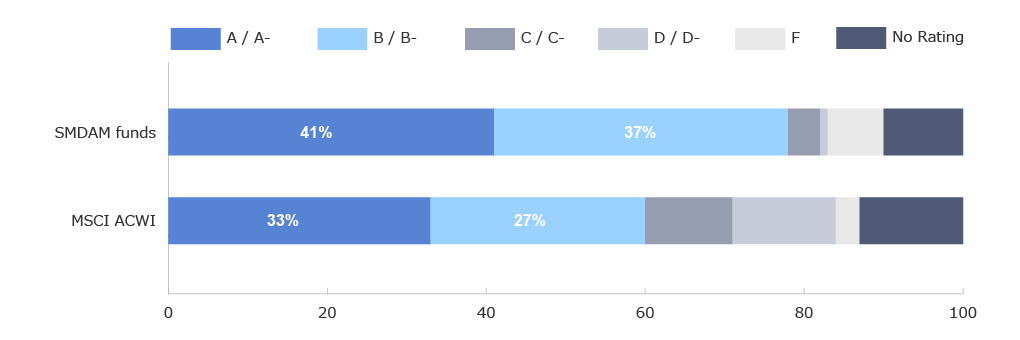
SMDAM became a CDP signatory in June 2021.
For more information about CDP, please visit the following site.
- SMDAM funds as of June 30, 2021
(source)SMDAM, FACTSET data and CDP”2021 CDP Scores”
Risk Management
1.Climate Change Risk Evaluation
We assess climate change risks of investee companies through proprietary ESG evaluations and assign scores based on the companies’ relative performance within their same sector. As climate change is one of our priority ESG themes, we conduct engagement primarily for sectors with high GHG emissions and companies with room to improve their ESG scores.
At the same time, for our major investment products, we measure climate change risk at the portfolio level. We utilize the resulting measurements for the overall portfolio and the investee companies that comprise it in investment decisions related to stock selection.
2.Management of Climate Change Risks
When climate change risk metrics are included in the investment guidelines of specific products, the Investment Management Division autonomously manages them just as it does other restrictions. Meanwhile, the Risk Management Department monitors compliance and invites the Investment Management Division to take the necessary actions or decide a policy to deal with such a situation if the threshold is closely approached or reached.
Portfolio Greenhouse Gas Emissions
Focusing on Japan and global equities and domestic and foreign fixed income products, we analyzed our portfolio against benchmarks (BM) for GHG emissions (Scopes 1 and 2) and three other metrics. The metrics are calculated using data provided by Sustainalytics.
|
GHG Emissions (Scopes 1 & 2) (Thousand tCO2e) |
Carbon Footprint (tCO2e/Million USD) |
Carbon Intensity (tCO2e/Million USD) |
Weighted Average Carbon Intensity (tCO2e/Million USD) |
Data Coverage (%) |
||||||
|---|---|---|---|---|---|---|---|---|---|---|
|
SMDAM |
Vs. BM (%) |
SMDAM |
Vs. BM (%) |
SMDAM |
Vs. BM (%) |
SMDAM |
Vs. BM (%) |
SMDAM |
Vs. BM (%) |
|
|
Japanese Equities |
3,510 |
126 |
97 |
121 |
143 |
115 |
143 |
145 |
94 |
98 |
|
Global Equities |
347 |
89 |
41 |
89 |
183 |
103 |
177 |
114 |
98 |
100 |
|
Japanese Fixed Income |
583 |
85 |
193 |
85 |
308 |
87 |
285 |
81 |
86 |
82 |
|
Global Fixed Income |
115 |
74 |
59 |
74 |
172 |
77 |
225 |
86 |
85 |
90 |
Benchmarks: Japanese equities use TOPIX; global equities, MSCI KOKUSAI; Japanese fixed income, Nomura BPI (corporate bonds); and global fixed income, Bloomberg Global Aggregate Ex-Japan - Corporate Total Return.
Please note that metric calculations were made for investment portfolios we directly manage as of June 30, 2021. Japanese and global fixed income exclude government bonds.
Metric Explanations and Calculation Methods
| Metric Explanation | Calculation Method | |
|---|---|---|
|
GHG Emissions (Scopes 1 & 2) |
Total GHG emissions linked to portfolio |
Σ [GHG emissions of issuers × (Market value of portfolio holdings) ÷ {(Issuer market cap) + (Total issuer interest-bearing debt)}] |
| Carbon Footprint |
GHG emissions per million USD of portfolio value |
Portfolio GHG emissions ÷ Portfolio value |
| Carbon Intensity |
GHG emissions per million USD of net sales of investee companies |
Portfolio GHG emissions ÷ Σ[(Net sales) × (Value of holdings) ÷ {(Issuer market cap) + (Total issuer interest-bearing debt)}] |
|
Weighted Average Carbon Intensity [TCFD recommended metric] |
Weighted average by holding weight of carbon intensity of each investee company |
Σ[{(GHG emissions) ÷ (Net sales)} × {(Value of holdings) ÷ (Portfolio value)}] |
Emissions from our Japan equities portfolio exceeded those of the benchmark for every metric. This was mainly attributable to the fact that a key investment product of ours is a Japan equity value investment strategy which overweight sectors like materials and industrials. Meanwhile, the weighted average carbon intensity of our portfolio was 145% of the benchmark. This was because the TOPIX benchmark does not include J-REITs, which have high emissions per unit of net sales, and without these J-REITs, our portfolio would be 106% of the benchmark.
Our GHG emissions from Japanese and global fixed income were generally below the benchmarks; our portfolio has a low environmental impact. With respect to our global equities portfolio, our carbon intensity and weighted average carbon intensity were 103% and 114% of the benchmark, respectively. This is in part because we hold materials-related companies in emerging countries with high emissions per unit of net sales that are not included in the benchmark and heavily overweight REITs. The other metrics were below the benchmark.
GHG Emissions from Japan Equities (Scopes 1 & 2)
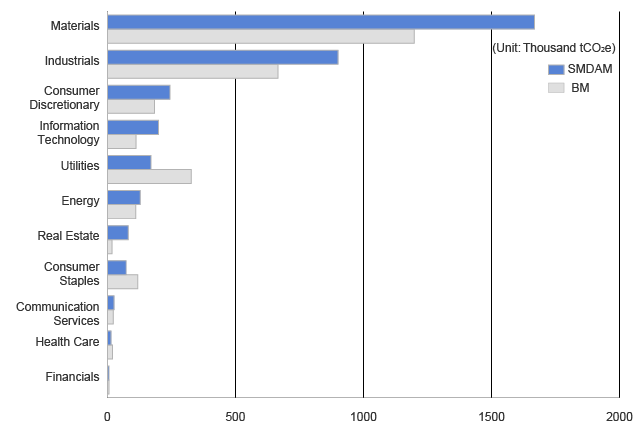
| Source: |
Created by Sumitomo Mitsui DS Asset Management based on GHG emissions data (actual figures when available and estimates) from Sustainalytics as of June 30, 2021Uses TOPIX as the benchmark. |
|---|

